
Managed Services: Monitoring
Jade Networks helps companies with the design, implementation, deployment, management and outsourcing of enterprise networks. We also help in areas including disaster planning and recovery, policy planning and analysis, network and vulnerability assessment, network automation, and others. Our managed services focus on both the operational and security aspects of enterprise networks. We break these services apart into Security, Monitoring, and Analysis/Response Systems however all are tightly related and are treated separately for descriptive purposes only. This document describes Monitoring Systems.
Monitoring systems actively collect and store data related to the enterprise network (network components, servers, devices, applications, workloads, etc). Network Management systems are the typical tool used for this purpose and provide the following functionalities: discovery, monitoring, performance analysis, device management, and event management (intelligent notifications or customized alerts). Most monitoring solutions come with integrated data visualization tools, anomaly detection, and incident reporting/action tools. The later are the building blocks for creation of automated response systems.
Jade Networks can assist with the design, implementation, and deployment of new monitoring systems or the expansion of existing ones. We can also provide on-site or remote monitoring services. Let us know how we can help.
Enterprise monitoring is tightly coupled with Enterprise Security and Analysis/Response Systems. What follows is a general overview to monitoring systems, and network management systems in particular. We close with a comparison between Network Management Systems and Security Information Event Management (SIEM) systems.
Network Management Systems
 Network Management systems can actively monitor a wide range of devices and sensors (temperature, fan speeds, power supply voltages, and more). They can also monitor operating system statistics and protocol availability (we use this to check SMTP, DNS, LDAP, HTTP, SSH and others on our network). What is not built into the base system can be added through simple scripts. For example we wrote a few simple scripts for collecting the SMART data from hard drives (temperature, error rates, etc) which the network management system collects and records. If you can write a script to check on something it is trivial to integrate it in allowing one to be able to monitor and track almost anything.
NM systems communicate with devices and systems using standard protocols such as the Simple Network Management Protocol (SNMP), Java Management Extensions (JMX), Intelligent Platform Management Interface (IPMI), or their own proprietary protocols. Internally we use the Zabbix Network Management platform and make extensive use of the Zabbix agents installed on each server. In the past we relied heavily upon SNMP however newer versions of Linux and Zabbix have made management through Zabbix agents much easier and quicker to deploy. For our use this has worked quite well however it should be noted that installing network management agents on customer servers may be a sensitive issue. For these customers as well as other legacy devices or platforms where we are unable to install custom software, SNMP and other standard management protocols will continue to be needed and used.
Monitoring and Visualization Tools
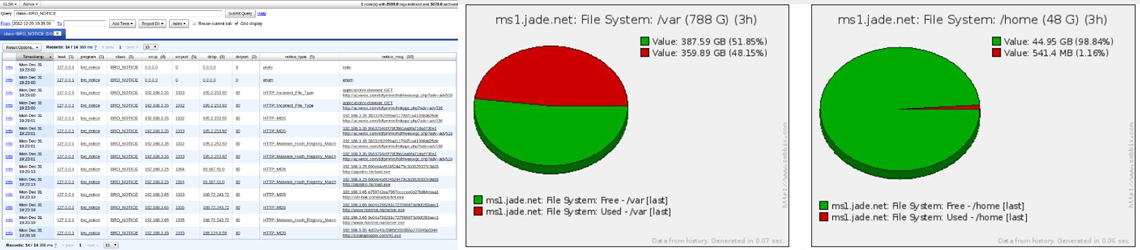
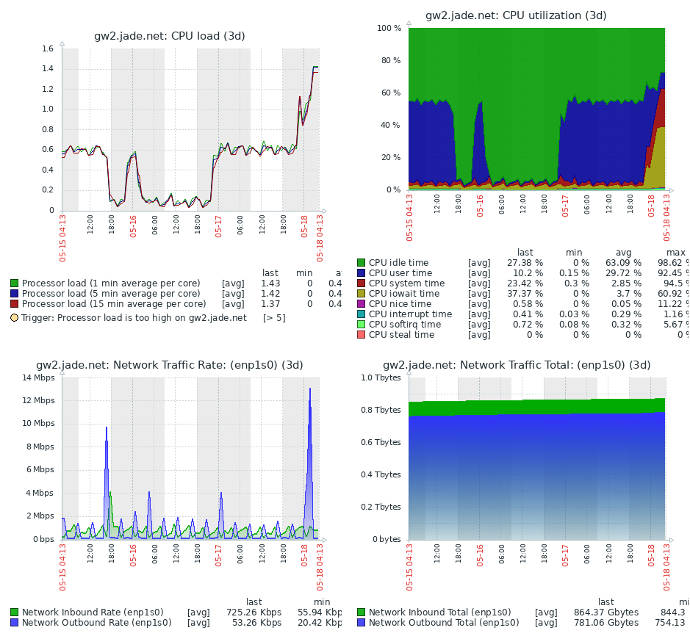
As seen above, as long as you can write a script or program to check and return information on an asset, you can collect, analyze, and act on such data through most network management platforms. Most systems also provide visualization tools allowing for the time based graphical display of the raw data. These tools allow for not only combining of data as needed but also for the application of statistical rules. For instance, instead of providing a graph of the number of packets in or out of a network interface at a given time, a far more useful visualization is the data rate (average rate over some moving window in time). Graphically displaying this rate rather than instantaneous values provides the network administrator the view they really need – how the actual bandwidth is being consumed over time and how it relates to circuit speeds. These techniques can be applied to any monitored data, not just interface statistics.
Discovery and Device Modeling
How does one add a new device to the network management platform? If there are only a few devices on the network then manually configuring each one of them, including their network address, sensors to monitor (and how), triggers for determining when something out of the ordinary has occured, and then what action to take can be done. If there are more than just a few devices to be monitored, or if the network undergoes regular changes or additions, then this process can be very time consuming, costly, and error prone.
Modeling of devices is the defining of characteristics and attributes to monitor that are common to all assets of the same type. It is usually better to break down a device into smaller functional models. For instance servers can be broken down into several sub-modules such as motherboard type, operating system, standard services, and specific services. The motherboard model would include information on sensors and interfaces found on all motherboards of the same type. The operating system model would contain basic definitions of OS services and methods used to access them. The services definitions would detail how to access specific types of services. The Jade mail MTA’s for instance are made up of several components which exist on every MTA. These models are then codified in the form of templates which can be used as needed when adding a new MTA to the network.
Discovery is the automated process by which new devices and services are found. The discovery process can be configured to automatically add new assets to the management system as they are found. The discovery process can speed up management deployment and simplify administration. It uses any combination of IP ranges, availability of external services (FTP, SSH, WEB, POP3, IMAP, TCP, etc), and information received from remote agents. Automatic actions that can be applied include sending notifications, adding/removing hosts, enabling/disabling hosts, adding hosts to a group, removing hosts from a group, linking hosts to/unlinking from a template, and executing remote scripts. Discovery combined with proper template design greatly simplifies the infrastructure management and reduces the time to get a new asset configured and into the system.
Anomaly Detection and Event (Incident) Management
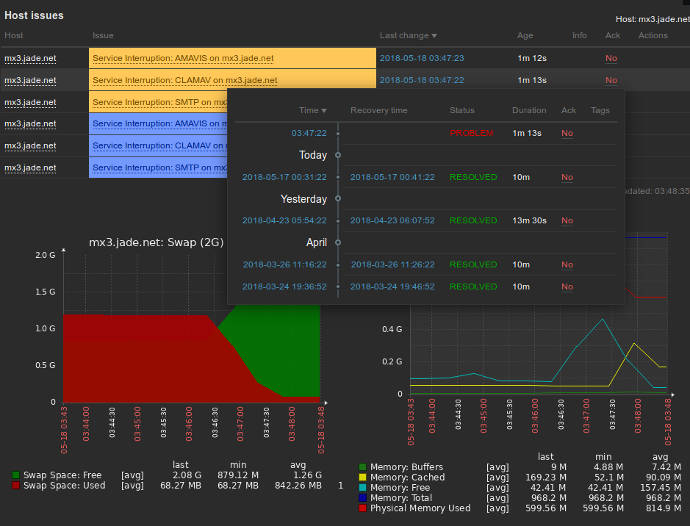
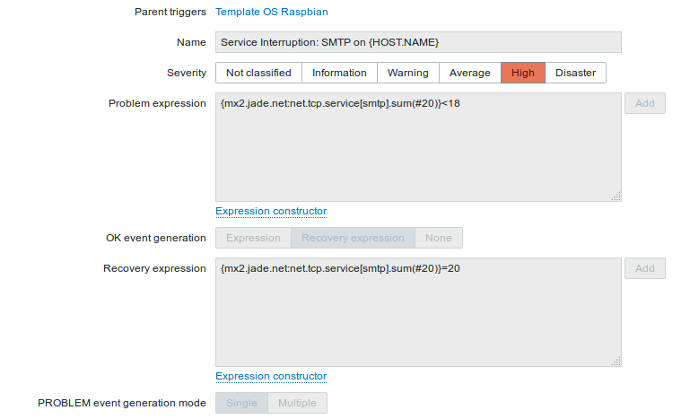 Being able to detect problems as they occur and do something meaningful is one of the main reasons we use network management systems (or perform most administrative tasks). Network management platforms provide the tools to define the symptoms problematic events exhibit. These conditions can be related to a single monitored value (can I successfully ping a remote machine for instance). They can also be based on complex expressions based on any combination of variables including time. For instance, if more than 3 of the past 10 DNS resolution attempts fail, AND if the machine does not return pings for 3 minutes, then signal a problem. There are virtually no limits to the number or types of expressions that can be built to test complex situations.
The configuration of conditions or expressions defining problematic situations is called an event or trigger. As network management systems collect data, they also check for configured trigger conditions. Each trigger is paired with an actions to take upon being detected and later to take after the problem has been resolved. These actions can be alerts sent by email or other means (instant messaging, SMS, etc) to notify a system administrator of the problem. They can also run any script or program to perform any action the administrator desires. For conditions that result in the execution of well defined procedures, these can be codified and called automatically upon detection.
The automation of response systems as seen above is an extremely powerful tool. Many conditions can be predicted in advance, and the corrective procedures put in scripts to be run upon detection. This results in systems that can not only detect when problems exist, but systems that fix themselves as they occur. Notifications can (and should) be sent in these situations, but the previous delays in getting a human administrator notified, time allocated, and then the problem resolved have been removed. Systems run better with less down time and administrators can focus their precious resources on more critical issues.
Network Management (NMS) and Security Information and Event Management (SIEM) Systems
 Network Management Systems (NMS) are similar to Security Information and Event Management (SIEM) systems (covered in the Analysis and Response section) but differ in how data is obtained and used. Network Management systems are used to capture data on arbitrary observable and measurable (quantifiable) aspects of an enterprise network. This includes sensor data, interface attributes, applications (local and network), databases, devices, and pretty much anything else that can be measured from a script, program, or via a standard network management interface/protocol.
Security Information and Event Management (SIEM) systems on the other hand get most of their data from machine generated files or feeds, and includes the intelligent consolidation and processing of logfile data. This information is reduced, filtered, and then analyzed and correlated with historic and/or external data. The data (raw and/or processed) is stored in a database for later reference. SIEM systems are primarily concerned with security and can make use of threat analysis feeds and information provided by local intrusion detection or prevention systems. In many commercial products the SIEM functionality is bundled with an IPS.
Both NMS and SIEM systems have the ability to generate alerts and perform actions based on the data they process. Both can be configured to graphically display the results of the analytics and take conditional action. As a rule of thumb (there are always exceptions) network management systems are better suited to the measuring of operational data. They monitor data that can be readily observed via the platform, programs, scripts, or through standard network management interfaces/protocols. This data (capacities, machine loading, sensors) is often better seen through network management platforms.
SIEM systems on the other hand, with their focus on security, are better suited in processing data generated by systems or applications. Logfile data often has more detailed information present than what can be observed from a distance. For instance malformed TCP packets designed to disrupt communication at the lower layers of the network stack are difficult to impossible to track with a network management system. Logfile data on the other hand can be configured to contain all the offending packet details for later analysis and correlation (our host security configurations are setup to do this). This information, especially when combined with external threat analysis and historic data, provides a very different view into what is happening on the network and forms the basis for more advanced countermeasures.
SIEM systems, when configured in a passive or offline mode, can be used to analyze huge amounts of data spread over a large period of time. By comparing this data with threat analysis feed data or with behavior analysis tools can detect problems that simple Network Management or active SIEM system will miss. They are also better suited for anomaly detection over a longer period of time.
As NMS and SIEM solutions continue to evolve, the capabilities of these systems continue to exhibit a greater degree of overlap in their functionality. Zabbix for instance has the ability to pull data in from logfiles. Some SIEM solutions come bundled with basic NMS functionality and can monitor remote resources via SNMP or other means. While not as efficient as NMS based approached, SIEM agents can be configured to provide many of the same data as a custom configured NMS. Based on the inherent differences in where and how they obtain their data as well as tools available for the processing of this information, both types of systems will continue to be essential tools in the managing of modern enterprise networks for some time. If these systems continue to evolve as they are now, we envision the day where only one solution type will be needed.
Last Modified: December 16, 2019